
KWC Chart School
Study the chart. Strengthen the process. Steward the capital.
A free Christian trading course connecting stock chart patterns, technical analysis, risk management, disciplined planning, and faithful stewardship.
13-part learning path
Kingdom Wealth Creator Learning Academy
Begin with the character and discipline of the Kingdom Trader, then move through base patterns, price and volume, momentum, resistance, reversal risk, and sell discipline.
Lesson library
One concept. One visual lesson. One practice question.
Each lesson page includes the video, a concise study guide, practical review points, and a direct route to the complete YouTube course.
 10:37
The Kingdom Trader: Faith, Stewardship & Discipline
A Christian trading introduction connecting faith, stewardship, disciplined planning, evidence, risk management, and the Armor of God.
Watch and study →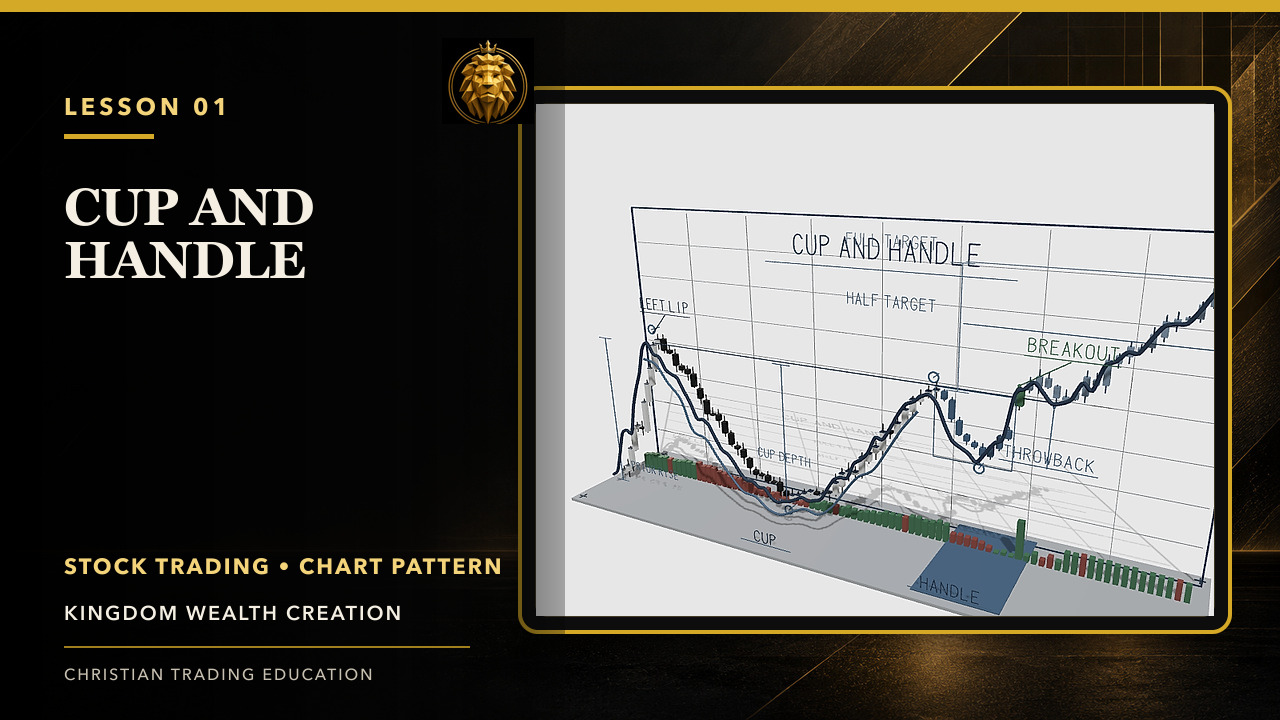 1:00
Cup and Handle Stock Chart Pattern Explained
Learn the cup and handle pattern: its rounded base, handle, volume contraction, breakout confirmation, throwback risk, and measure-rule framework.
Watch and study →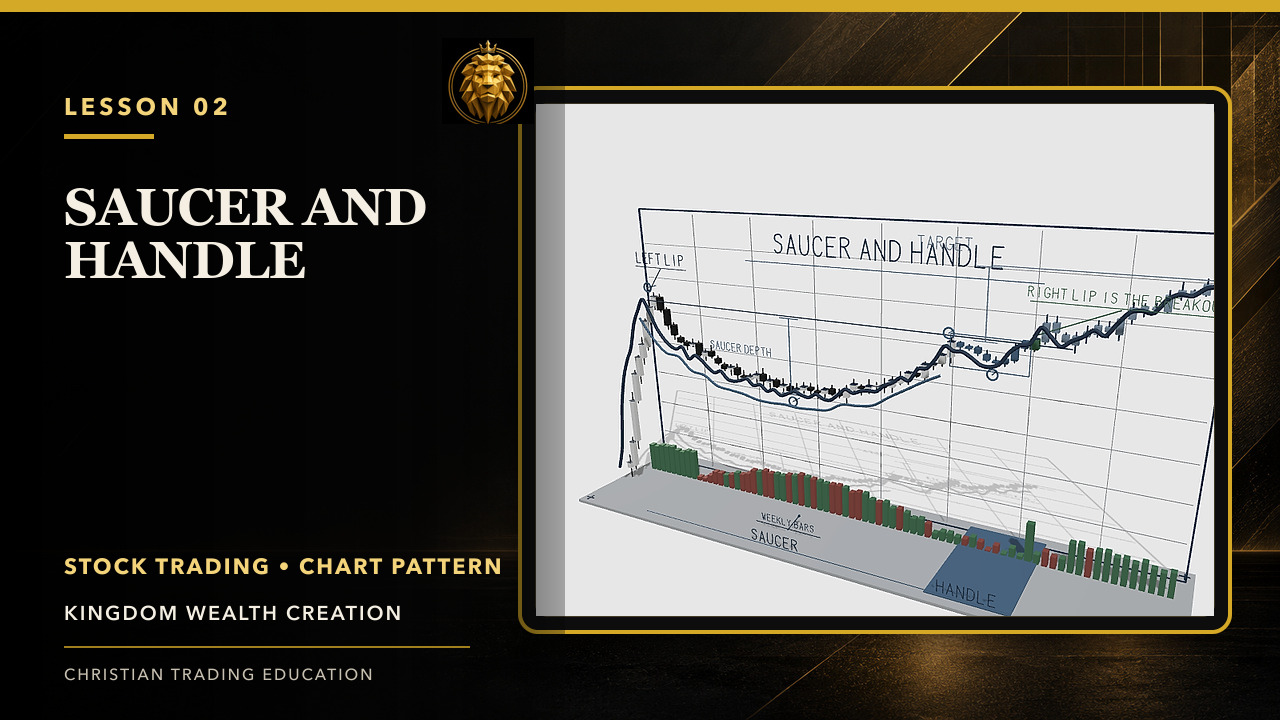 2:03
Saucer and Handle Stock Chart Pattern Explained
Study the saucer and handle pattern: its long, shallow weekly base, volume curve, optional handle, right-lip resistance, and breakout confirmation.
Watch and study →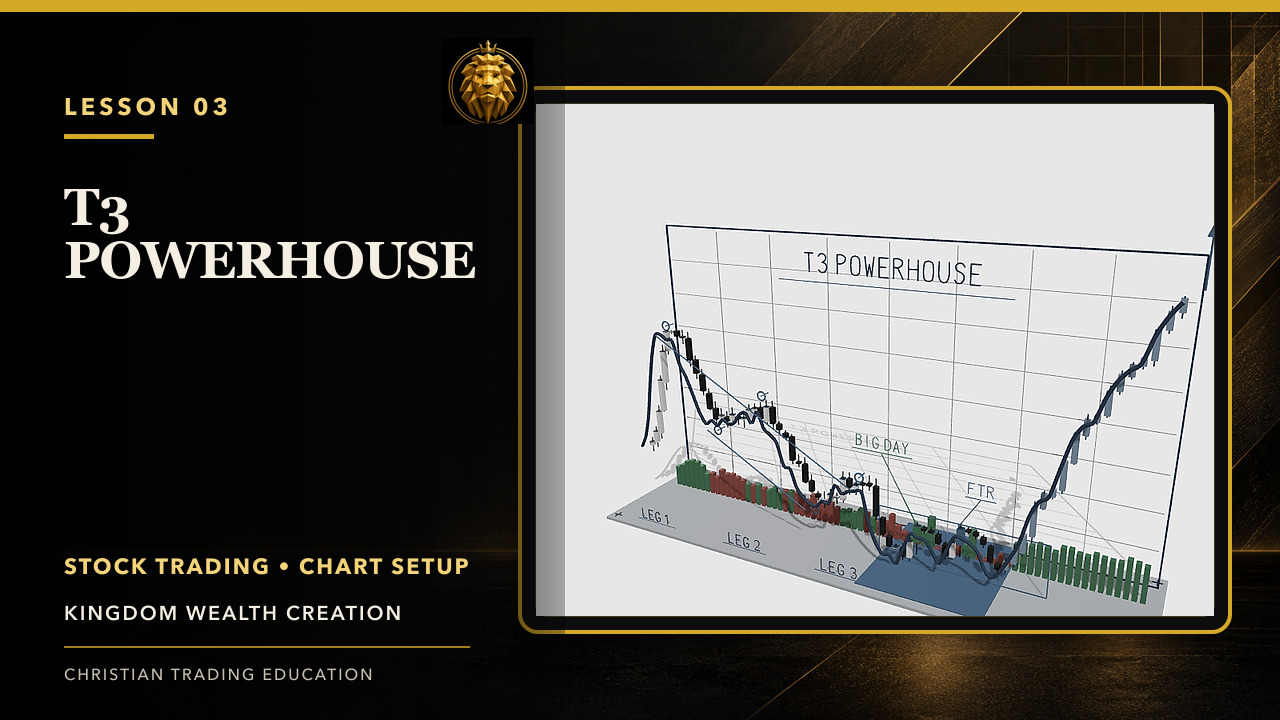 2:10
T3 Powerhouse Stock Trading Setup Explained
Study the T3 Powerhouse setup: three descending legs, an M-shaped base, volume dry-up, the expansion day, and follow-through confirmation.
Watch and study →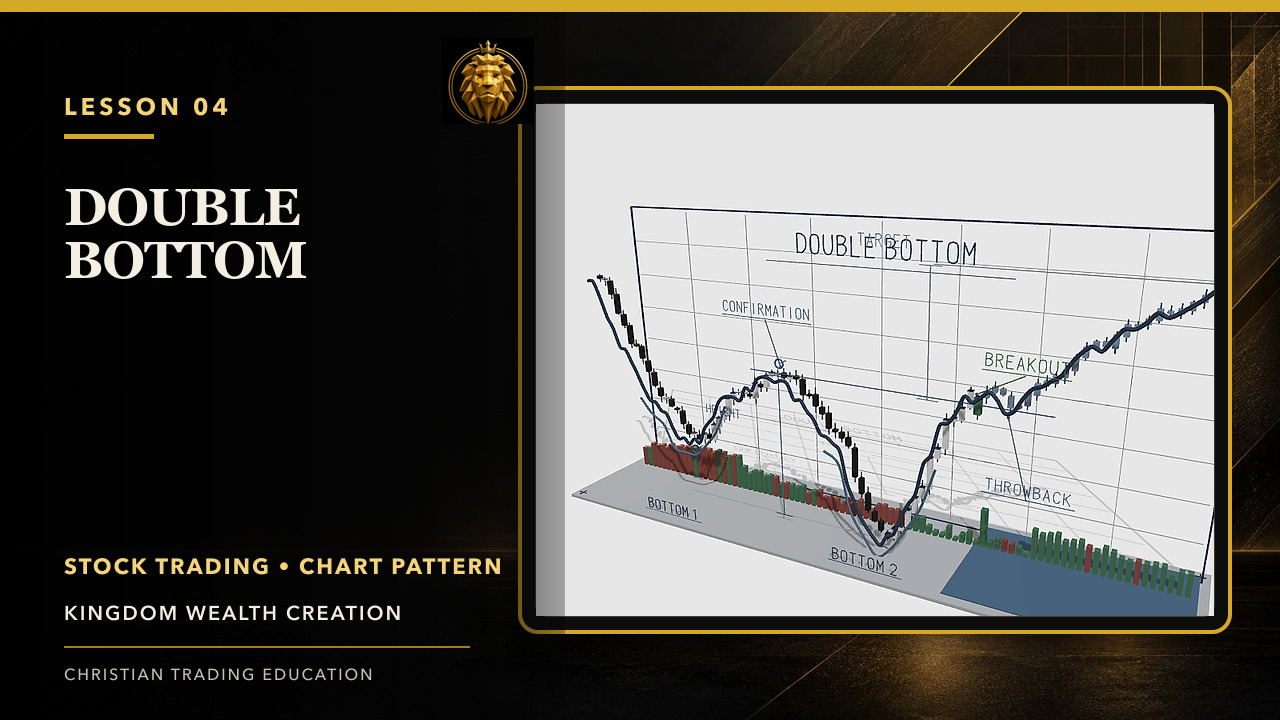 2:06
Double Bottom Stock Chart Pattern Explained
Learn the double bottom pattern: the prior downtrend, two lows, separating peak, undercut behavior, volume clues, and confirmation level.
Watch and study →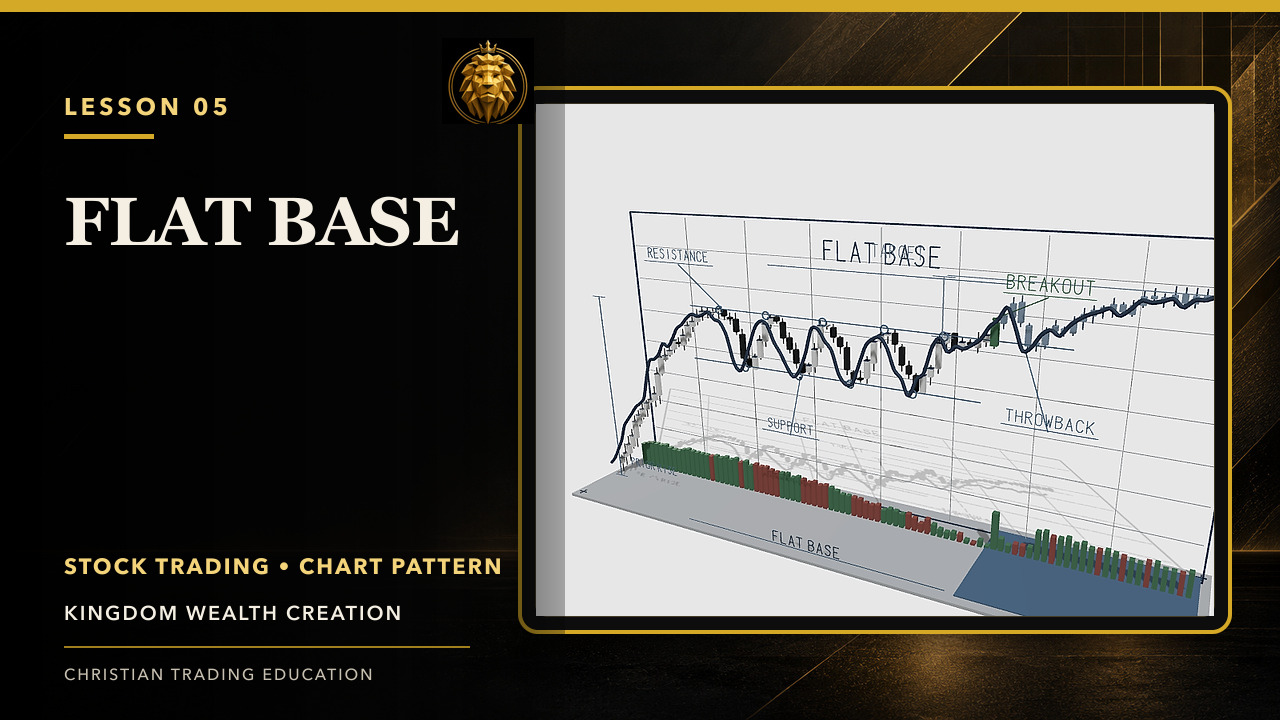 2:15
Flat Base Stock Chart Pattern Explained
Learn the flat base pattern: the prior advance, tight support and resistance, repeated touches, volume contraction, and breakout confirmation.
Watch and study →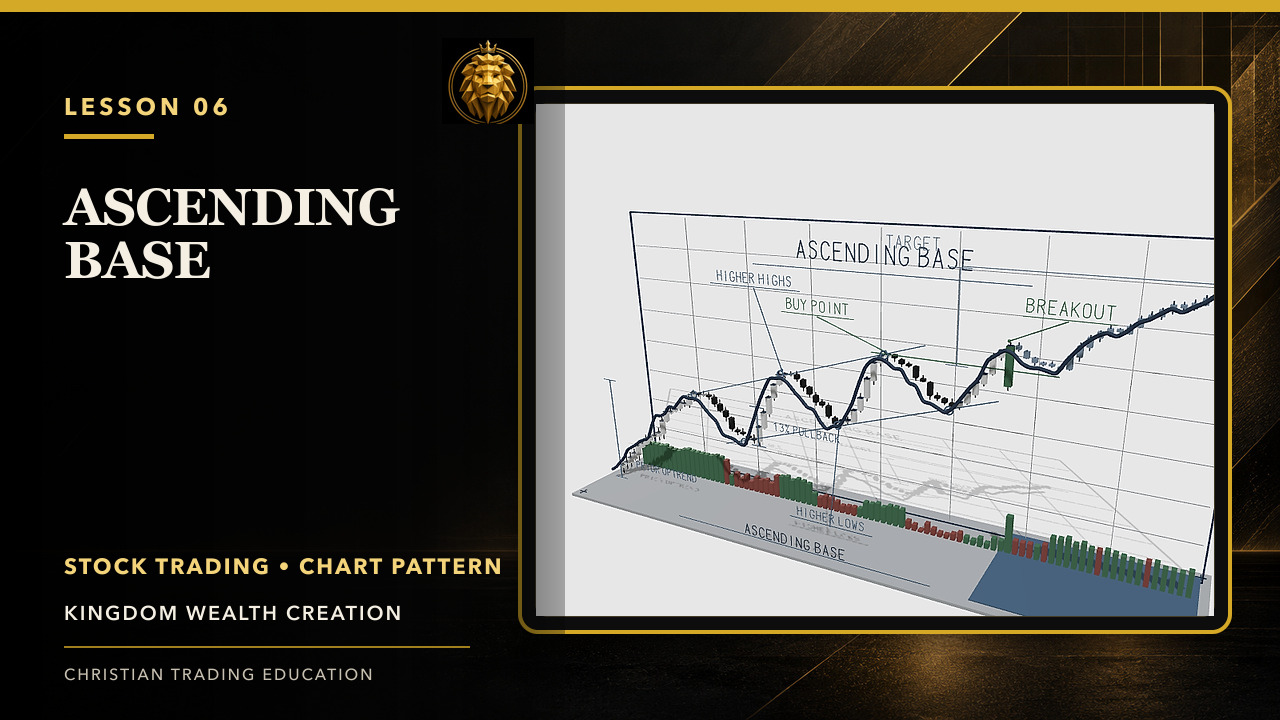 2:07
Ascending Base Stock Chart Pattern Explained
Learn the ascending base pattern: three rising pullbacks, relative strength during a broader correction, volume behavior, and final resistance.
Watch and study →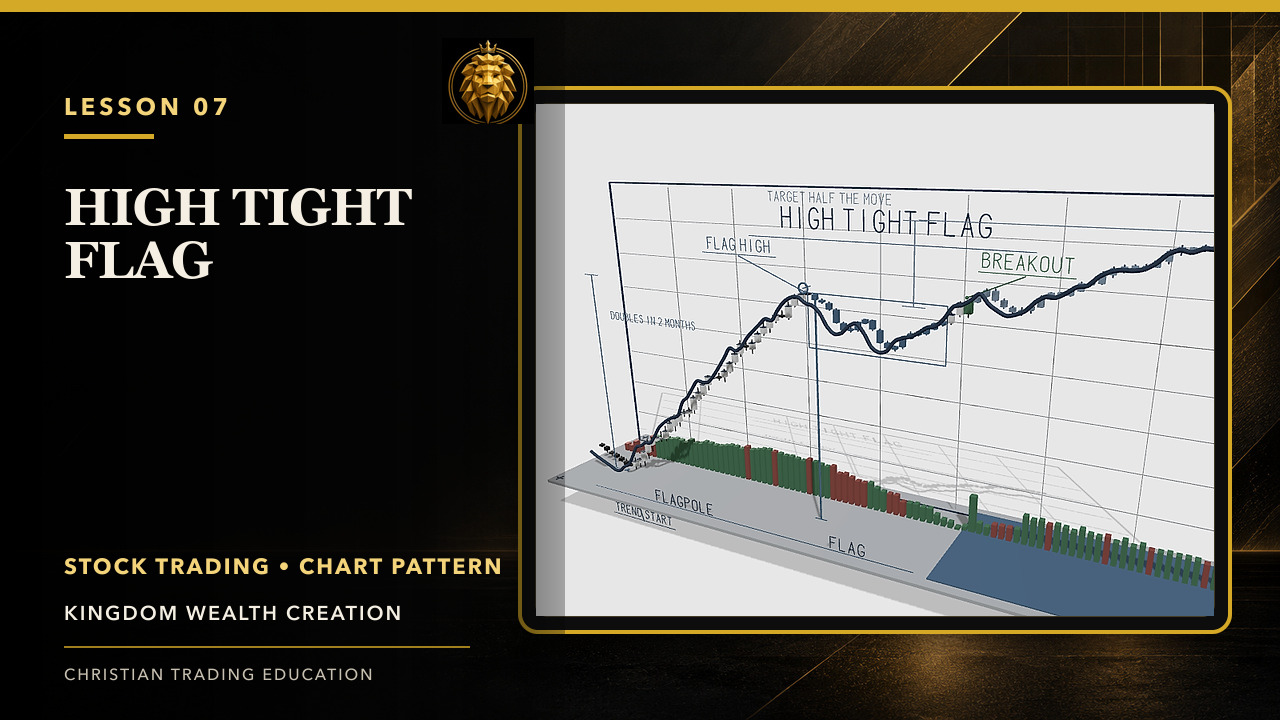 2:11
High Tight Flag Stock Chart Pattern Explained
Learn the high tight flag pattern: its rapid prior advance, brief consolidation, limited pullback, volume contraction, breakout level, and demanding risk profile.
Watch and study →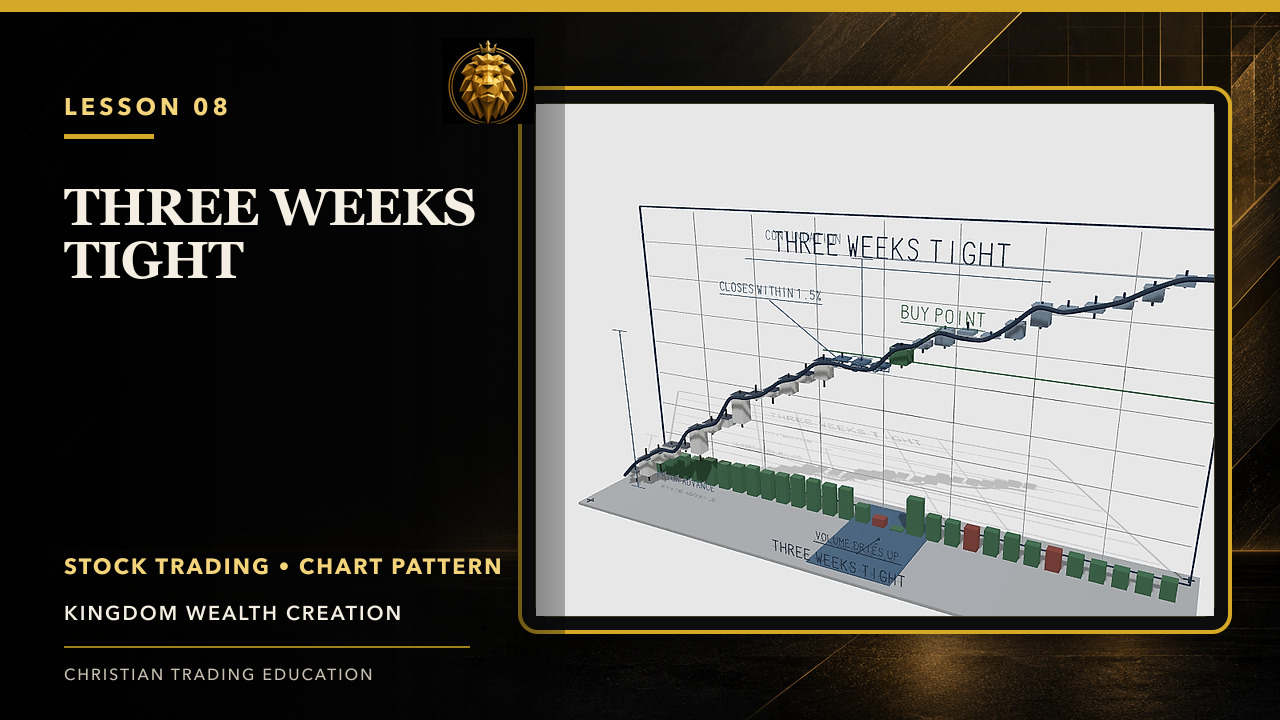 2:10
Three Weeks Tight Stock Chart Pattern Explained
Learn the three weeks tight pattern: a prior advance, tightly grouped weekly closes, drying volume, continuation logic, and a confirmation pivot.
Watch and study →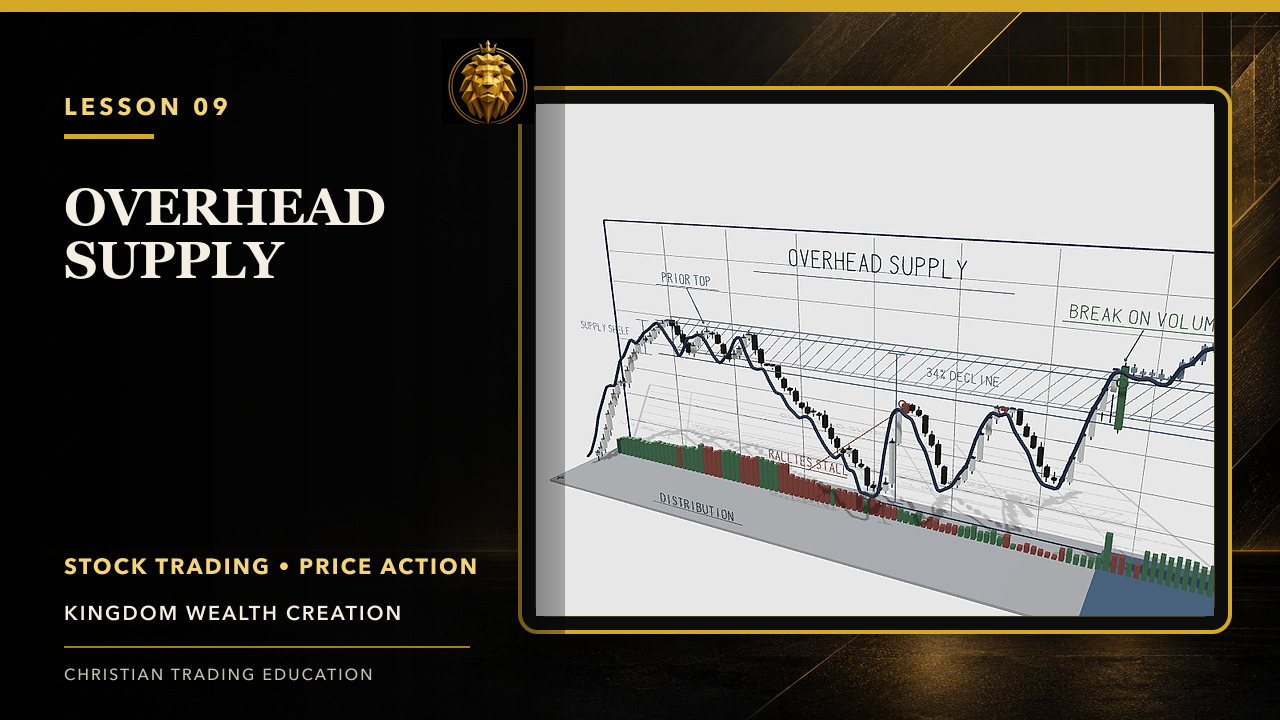 2:07
Overhead Supply in Stock Trading Explained
Understand overhead supply: how trapped holders can create resistance, how congestion becomes a price ceiling, and how volume can reveal absorption.
Watch and study →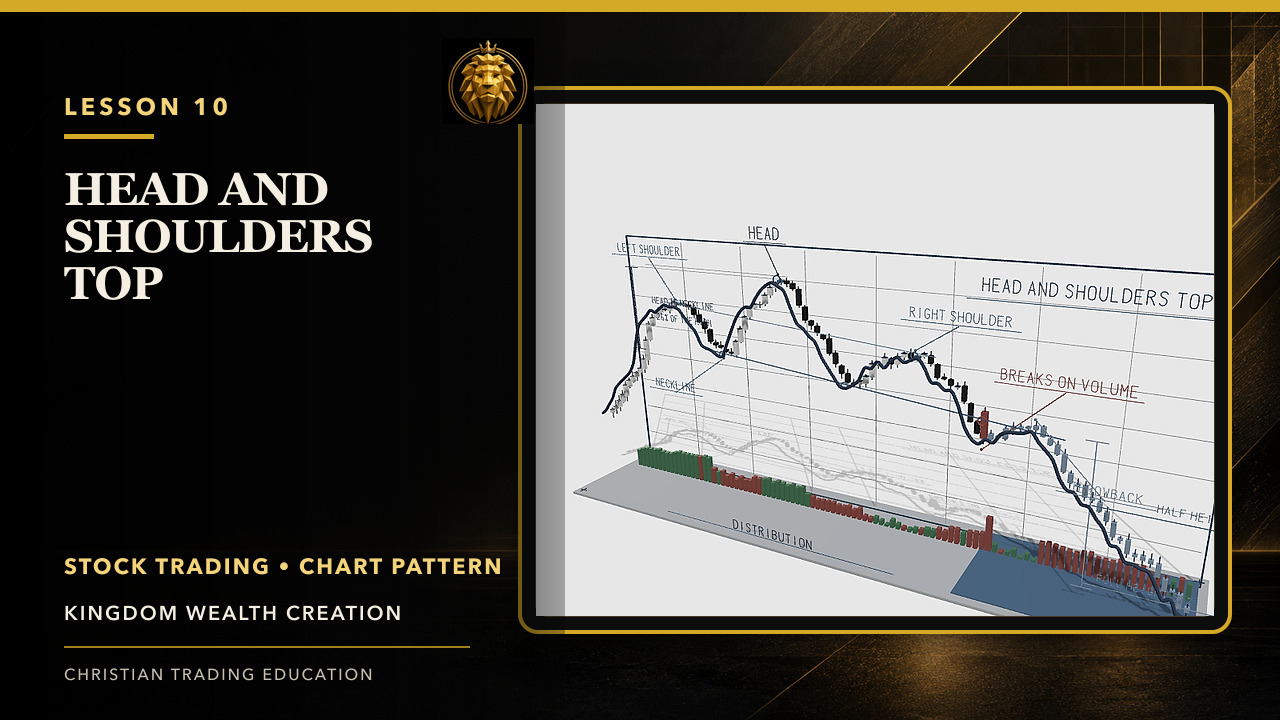 2:10
Head and Shoulders Top Pattern Explained
Learn the head and shoulders top: three peaks, the neckline, weakening volume, distribution clues, confirmation break, and throwback risk.
Watch and study →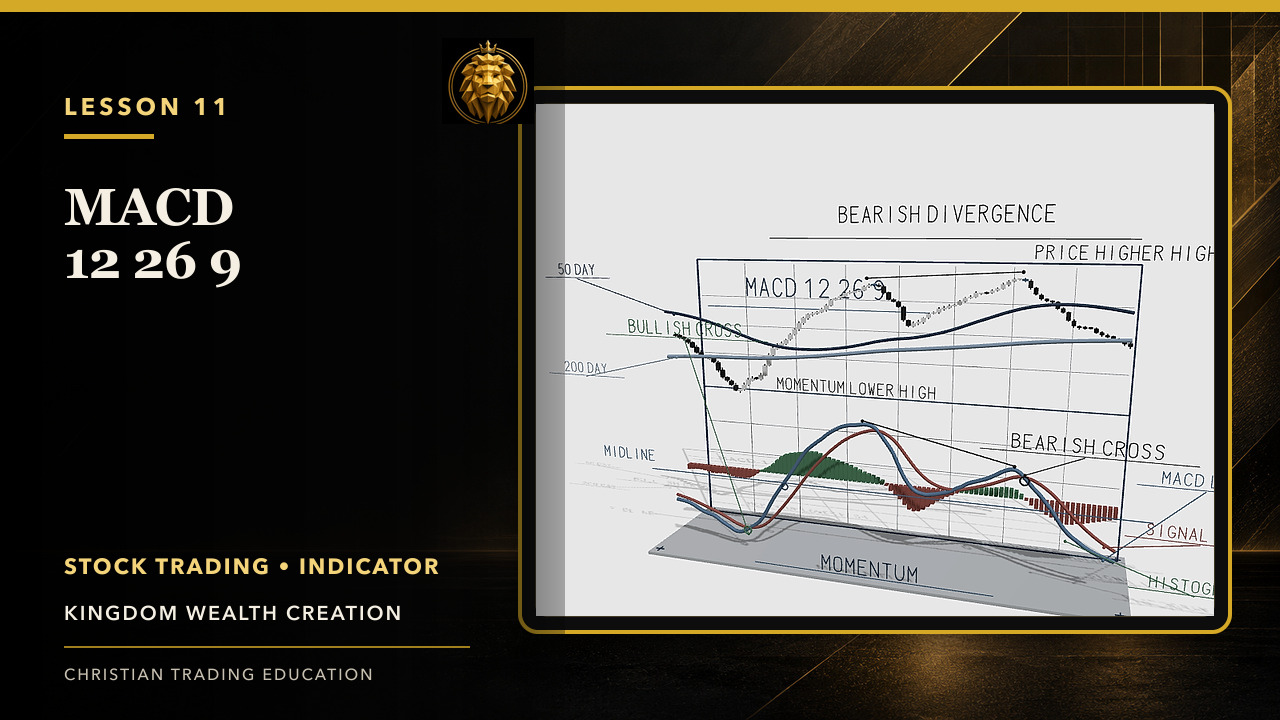 2:14
MACD 12-26-9 Indicator Explained
Learn MACD 12-26-9: the MACD line, signal line, histogram, zero line, crossovers, divergence, and the need for price-and-volume context.
Watch and study →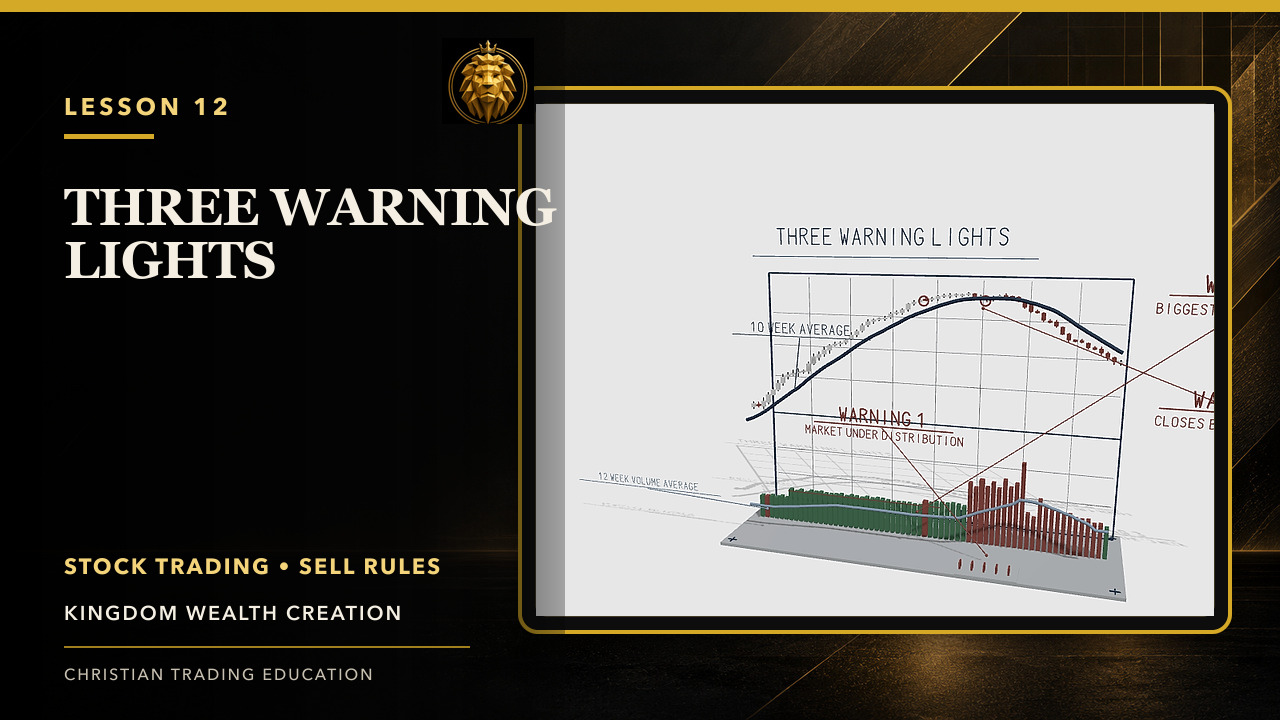 2:10
Three Warning Lights: Stock Sell Rules
Learn three warning lights for stock sell discipline: a deteriorating market, unusually heavy downside volume, and a weekly moving-average break.
Watch and study →Use the course well
Move from recognition to a written process.
Watch once for understanding. Watch again with a chart and journal open. Mark the structure, confirmation, invalidation, and reason to wait. Practice on completed historical charts before applying the lesson to live capital.
Faith governs the trader. Discipline governs the process. Evidence governs the trade.