
KWC Chart School · Lesson 09
Overhead Supply in Stock Trading Explained
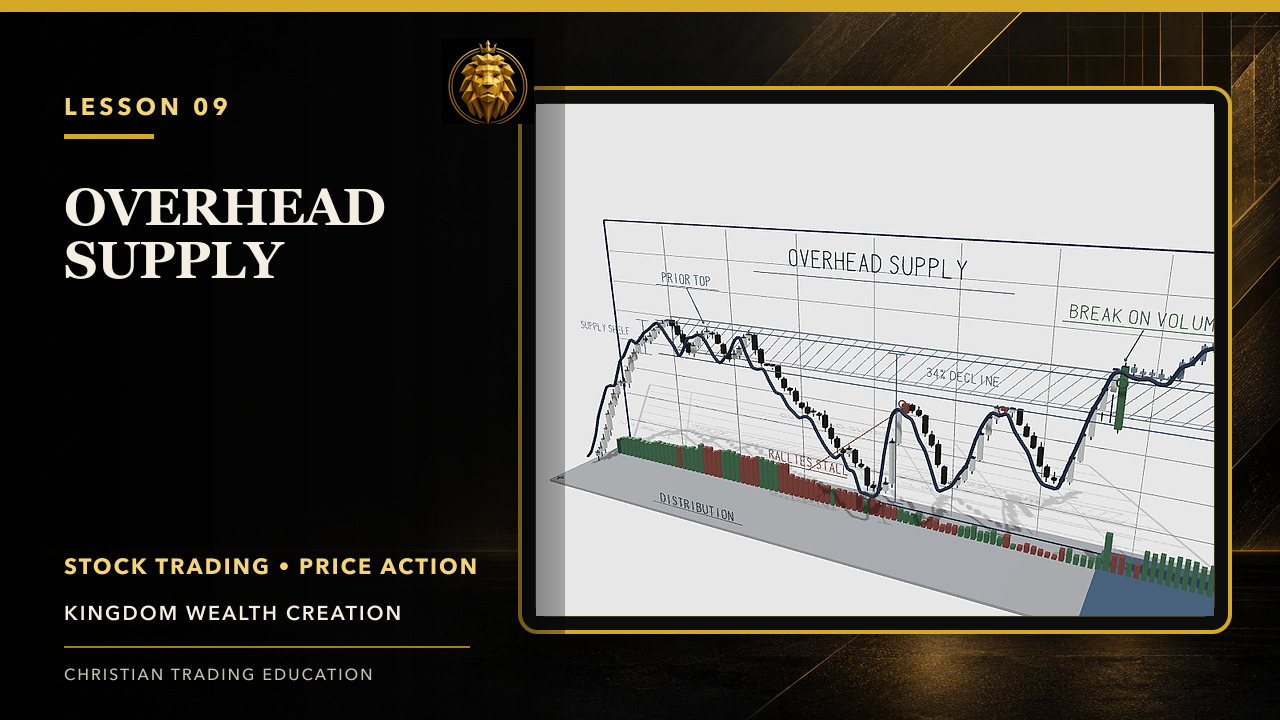
Understand overhead supply: how trapped holders can create resistance, how congestion becomes a price ceiling, and how volume can reveal absorption.
Study guide
What to look for.
- Map prior congestion and trapped-holder zones
- Distinguish resistance from a confirmed ceiling
- Use price and volume to evaluate supply absorption
Why it matters
A chart records prior decisions. Recognizing where disappointed holders may sell helps a trader plan for resistance without pretending to know each participant's intent.
Practice prompt
Shade the nearest overhead congestion zone and write what price-and-volume behavior would show that supply is being absorbed.
Stewardship boundary
Evidence before action.
Use the lesson to improve observation and planning—not to predict guaranteed outcomes. Define the setup, confirmation, invalidation, and risk before capital is committed.