
KWC Chart School · Lesson 07
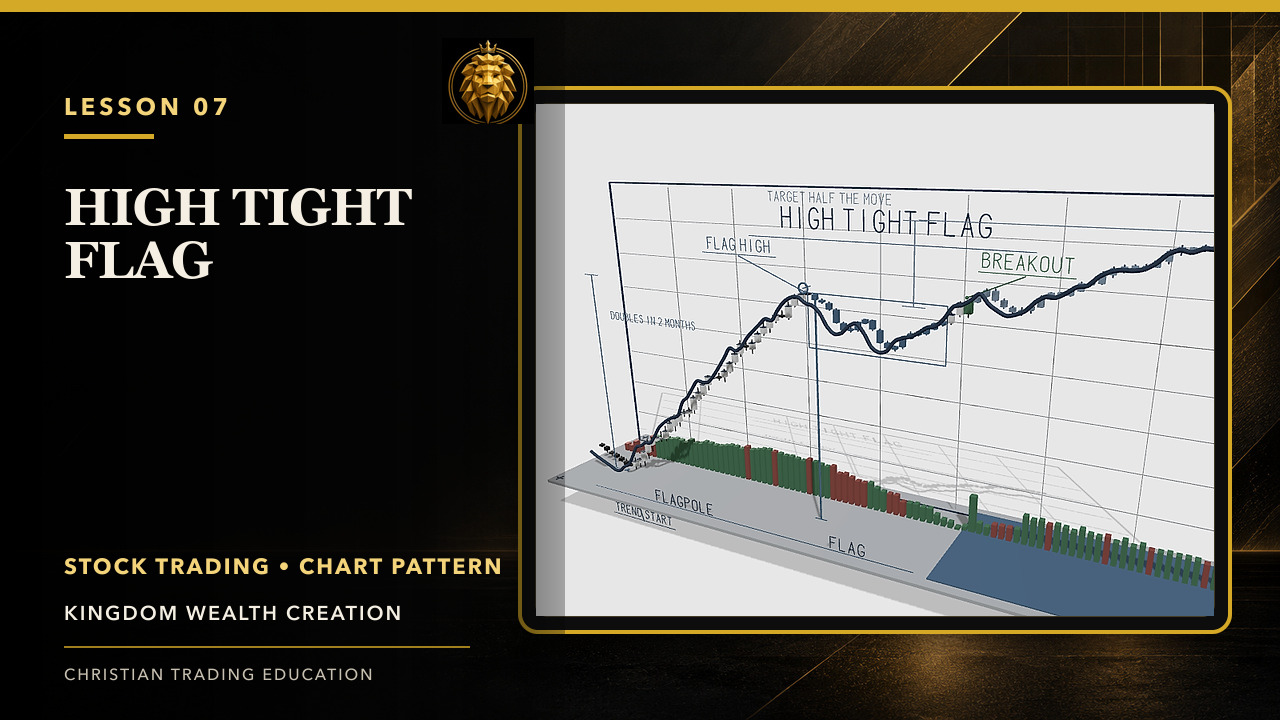
High Tight Flag Stock Chart Pattern Explained
Learn the high tight flag pattern: its rapid prior advance, brief consolidation, limited pullback, volume contraction, breakout level, and demanding risk profile.
Study guide
What to look for.
- Require an exceptional prior advance
- Judge the flag's duration, depth, and volume
- Avoid relabeling ordinary volatility as a rare setup
Why it matters
Because the setup is rare and volatile, loose definitions can create false confidence. Strict criteria and smaller risk assumptions protect against pattern enthusiasm.
Practice prompt
Reject examples that fail the prior-advance or tight-consolidation criteria before evaluating any potential entry.
Stewardship boundary
Evidence before action.
Use the lesson to improve observation and planning—not to predict guaranteed outcomes. Define the setup, confirmation, invalidation, and risk before capital is committed.