
KWC Chart School · Lesson 08
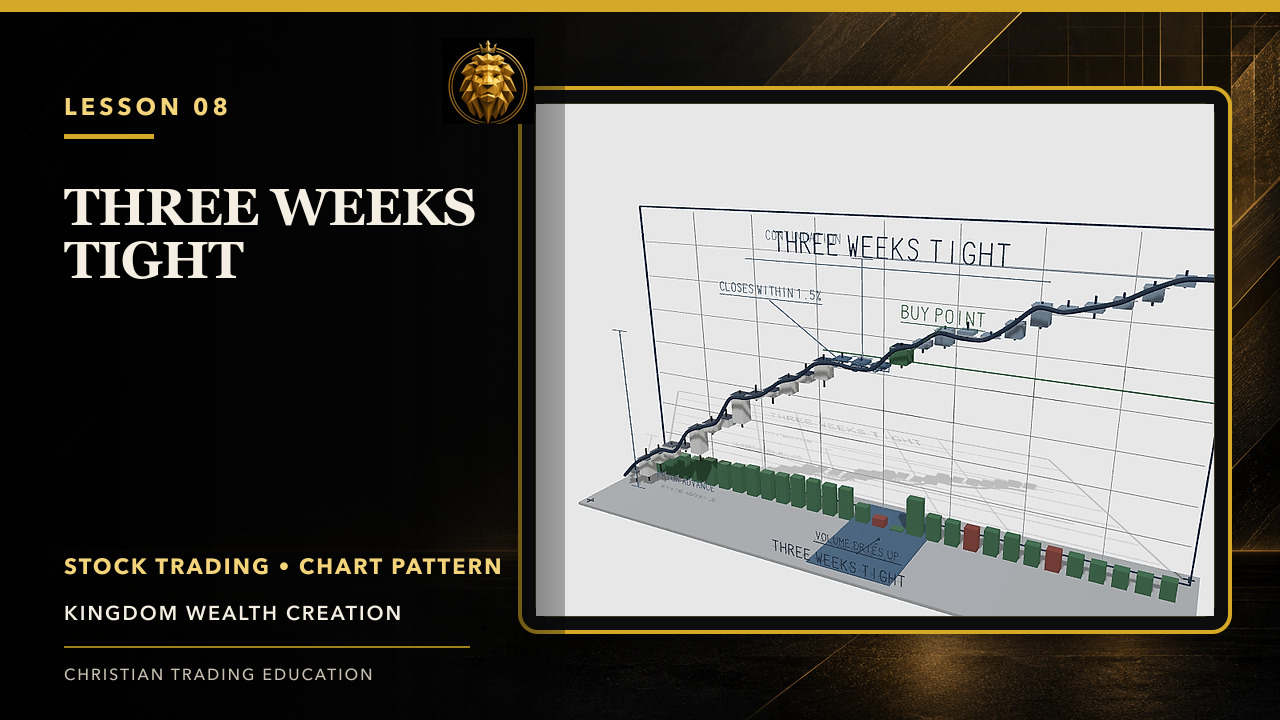
Three Weeks Tight Stock Chart Pattern Explained
Learn the three weeks tight pattern: a prior advance, tightly grouped weekly closes, drying volume, continuation logic, and a confirmation pivot.
Study guide
What to look for.
- Work from weekly closes rather than intraday noise
- Assess tightness after a prior advance
- Use volume and the pivot to evaluate confirmation
Why it matters
Tight weekly closes can signal that holders are reluctant to sell, but a continuation thesis still needs a defined pivot and invalidation.
Practice prompt
Calculate the spread among three weekly closes and compare volume with the weeks that preceded the consolidation.
Stewardship boundary
Evidence before action.
Use the lesson to improve observation and planning—not to predict guaranteed outcomes. Define the setup, confirmation, invalidation, and risk before capital is committed.