
KWC Chart School · Lesson 11
MACD 12-26-9 Indicator Explained
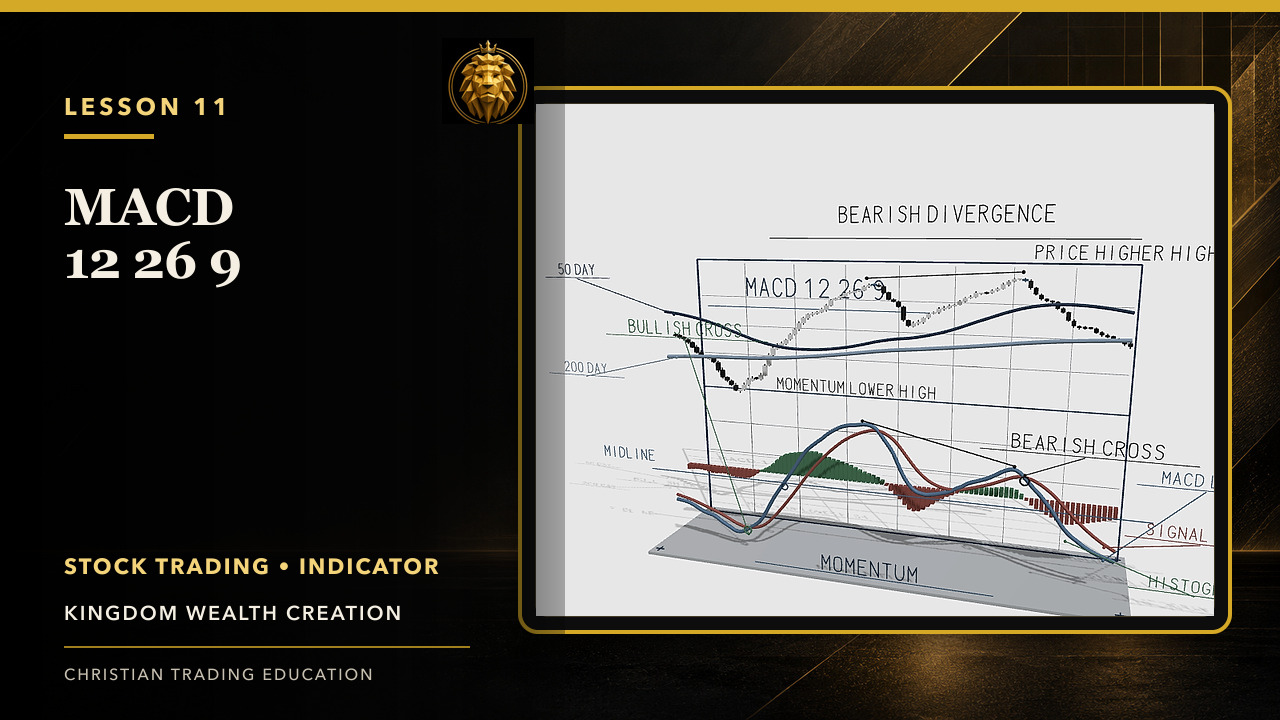
Learn MACD 12-26-9: the MACD line, signal line, histogram, zero line, crossovers, divergence, and the need for price-and-volume context.
Study guide
What to look for.
- Understand the MACD line, signal line, and histogram
- Interpret zero-line and crossover context
- Treat divergence as evidence to investigate—not a standalone command
Why it matters
Indicators summarize price behavior; they do not replace it. Reading MACD beside trend, price structure, and volume reduces the temptation to trade a single signal in isolation.
Practice prompt
Compare three MACD crossovers with the underlying price trend and record which had confirming structure and volume.
Stewardship boundary
Evidence before action.
Use the lesson to improve observation and planning—not to predict guaranteed outcomes. Define the setup, confirmation, invalidation, and risk before capital is committed.