
KWC Chart School · Lesson 04
Double Bottom Stock Chart Pattern Explained
Learn the double bottom pattern: the prior downtrend, two lows, separating peak, undercut behavior, volume clues, and confirmation level.
Study guide
What to look for.
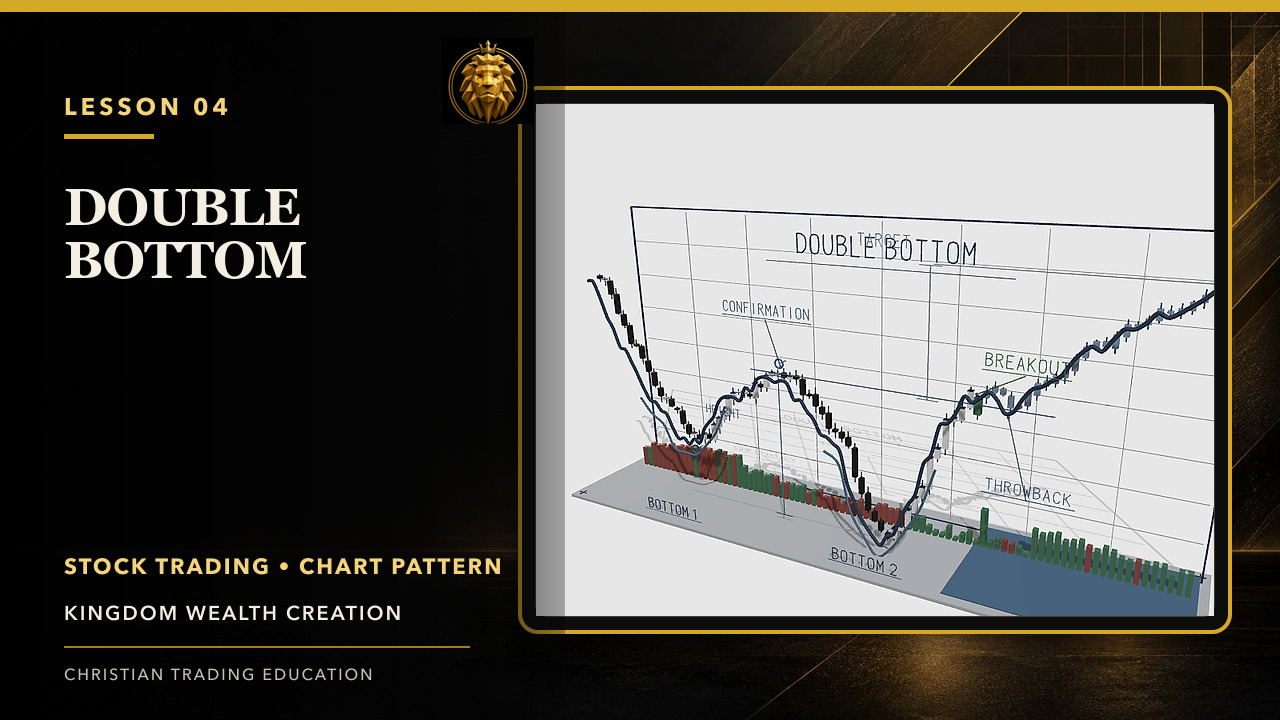
- Locate the two lows and the separating peak
- Understand why an undercut can test remaining supply
- Use a break above the middle peak as confirmation
Why it matters
Two lows alone do not complete a reversal. Confirmation helps prevent a trader from confusing temporary support with a durable change in trend.
Practice prompt
On three examples, record whether the second low undercut the first and whether the separating peak was later reclaimed.
Stewardship boundary
Evidence before action.
Use the lesson to improve observation and planning—not to predict guaranteed outcomes. Define the setup, confirmation, invalidation, and risk before capital is committed.